RetailBoss Insights
Brand Data
The numbers shaping retail, made visual.
Explore proprietary RetailBoss brand data, rankings, visualizations and infographics covering retail, luxury, fashion, beauty, web traffic, AI search visibility and consumer demand.
Retail market intelligence
See how brands are valued, discovered and compared.
RetailBoss Brand Data brings company scale, digital attention and consumer demand into one editorial collection. The library is built for executives, founders, analysts, marketers, investors and brand leaders who need a clearer view of competitive movement across retail.
Explore visual comparisons across luxury, fashion, beauty, ecommerce and resale, including brand rankings, market capitalization, web traffic, AI search visibility and product-level demand.
Latest infographics
Brand data, made visual.
Search the collection or filter by the signal you want to understand. Open any graphic for a closer view and its sourcing context.
35 graphics
Free account feature — Log in to view full-size infographics, download originals and copy embed codes.
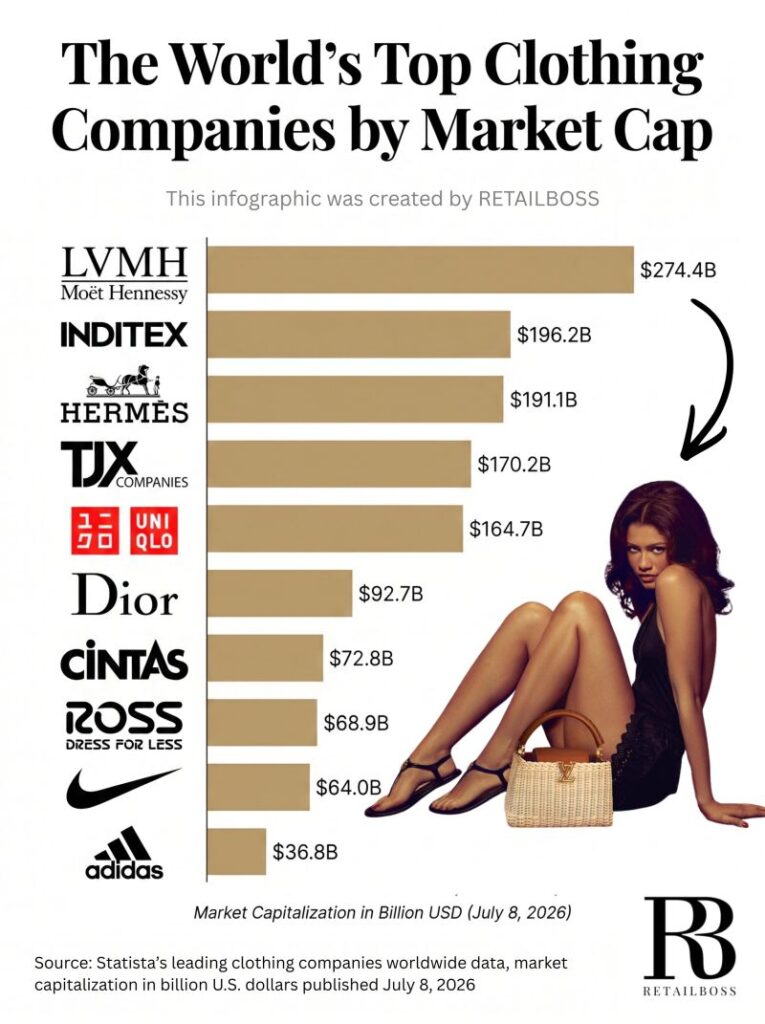
The World’s Top Clothing Companies by Market Cap
A comparison of LVMH, Inditex, Hermès, TJX Companies, Fast Retailing, Dior and other leading clothing companies by market capitalization in July 2026.
Luxury Brand Web Traffic: Asia-Pacific Overtakes Europe in 2026
Regional web traffic across Chanel, Louis Vuitton, Dior, Hermès, Gucci and Prada, showing Asia-Pacific as the largest measured luxury digital market in Q1 2026.
Which Beauty Retailer Wins AI Search?
Average monthly chatbot traffic across Ulta Beauty, Sephora, Boots, FragranceNet and Bath & Body Works from January through June 2026.
Which Athleisure Brand Wins AI Search?
Average monthly chatbot traffic across Nike, Adidas, Lululemon, Puma, Gymshark, On, Hoka, Alo Yoga, Fabletics and Vuori from January through June 2026.
Which Luxury Resale Site Wins AI Search?
Average monthly chatbot traffic across Vestiaire Collective, The RealReal, Fashionphile, Rebag and What Goes Around NYC from January through June 2026.
Which Fashion Retailer Wins AI Search?
Average monthly chatbot traffic across Shein, H&M, Uniqlo, Mango, Fashion Nova, Aritzia and other fashion retailers from January through June 2026.
The Most Popular Chanel Products
A product-demand ranking led by Bleu de Chanel, Chanel 25, Wide Ballerina Flats, Water Tint and Allure Homme Sport, based on estimated monthly search volume.
The Most Popular Gucci Products
A product-demand ranking led by Gucci Guilty, Gucci Flora, Gucci Bloom, the Jackie Bag and Ophidia Bags, based on estimated monthly search volume.
Mejuri Jewelry Pricing Strategy
Mejuri's assortment is concentrated in accessible price tiers, with the lowest measured price bucket accounting for the largest shares of both product prices and revenue.
SKIMS Pricing Strategy
SKIMS shows its highest product-price concentration in the $11 and $24 buckets, which together represent 41% of the measured assortment.
Burberry Pricing Strategy
Burberry's measured assortment is led by the $391 price bucket, followed by the $135 and $647 tiers.
Glossier Pricing Strategy
Glossier's measured assortment is concentrated in the $13 and $21 price buckets, together representing nearly half of product prices.
Kylie Cosmetics Pricing Strategy
Kylie Cosmetics is heavily concentrated in the $18 and $23 price buckets, which account for 76% of the measured assortment.
House of CB Pricing Strategy
House of CB's measured assortment and revenue are concentrated in the $258 and $282 price tiers, with the $282 bucket producing the largest revenue share.
Brunello Cucinelli Pricing Strategy
Brunello Cucinelli's measured assortment is concentrated at $390 and $945, while the $945 tier delivers the largest revenue share.
Gucci vs. YSL Web Traffic by Market
Gucci leads Saint Laurent in the United States, United Kingdom, Italy and Canada, while YSL records stronger traffic in France and Australia.
Prada vs. Miu Miu Generational Web Audience
Miu Miu draws the larger Gen Z audience share, while Prada shows stronger reach among Millennials and Gen X consumers.
Prada vs. Miu Miu Web Traffic by Market
Prada leads Miu Miu across the United States, South Korea, Japan, the United Kingdom and Italy, with the largest gap in the U.S. market.
Chanel vs. Gucci Web Traffic by Market
Chanel leads Gucci in five of six measured markets, while Gucci records the stronger result in Italy.
Rhode Skin vs. Rare Beauty Web Traffic by Country
Rhode Skin leads Rare Beauty across all seven measured markets, with the Netherlands showing the closest competitive split.
Where Rhode Skin’s Global Digital Reach Is Highest
Rhode Skin's largest measured digital market is the United States, followed by Australia, the United Kingdom, Canada and Italy.
Tory Burch vs. Kate Spade Web Traffic by Market
Tory Burch leads Kate Spade across all five measured markets, with the greatest traffic volumes and gap in the United States.
SHEIN vs. Temu Generational Web Audience
SHEIN captures the larger Gen Z audience share, while Temu records stronger appeal among Millennials and a notably larger Gen X share.
Alo Yoga vs. Lululemon Generational Web Audience
Alo Yoga captures the larger Gen Z audience share, while Lululemon records stronger reach among Millennials and Gen X consumers.
Gymshark vs. Under Armour Generational Web Audience
Gymshark draws a majority Gen Z audience, while Under Armour has larger Millennial and Gen X audience shares.
Hermès vs. Goyard Generational Web Audience
Goyard records larger Millennial and Gen X audience shares, while Hermès reaches a larger share of Gen Z consumers.
COS vs. H&M Group Generational Web Audience
COS and H&M Group both draw strong Gen Z and Millennial audiences, with COS slightly more concentrated among Gen Z consumers and H&M Group among Millennials and Gen X.
Coach vs. Coach Outlet Generational Web Audience
Coach records larger Gen Z and Millennial audience shares, while Coach Outlet draws a substantially larger Gen X share.
Loewe vs. Celine Generational Web Audience
Loewe draws the larger Gen Z audience share, while Celine records stronger reach among Millennials and Gen X consumers.
Loewe vs. Jacquemus Generational Web Audience
Jacquemus captures the larger Gen Z audience share, while Loewe records stronger reach among Millennials and Gen X consumers.
Tory Burch vs. Kate Spade Generational Web Audience
Kate Spade draws the larger Gen Z audience share, while Tory Burch records stronger reach among Millennials and Gen X consumers.
Rolex vs. Cartier Generational Web Audience
Cartier captures the larger Gen Z audience share, while Rolex records stronger reach among Millennials and Gen X consumers.
Rolex vs. Patek Philippe Generational Web Audience
Rolex records the larger Gen X audience share, while Patek Philippe draws larger Millennial and Gen Z shares.
Most Searched Lipstick Brands Ranked
RetailBoss ranks ten leading lipstick brands by cross-platform search momentum, with MAC leading the global lip category ahead of Maybelline New York and MARS Cosmetics.
Steve Madden Ballerina Heels Lead Rising Search Interest
RetailBoss compares eight fashion and footwear brands by 2026 cross-platform high-heel search growth. Steve Madden leads at +2,800%, ahead of Coach at +530% and Jessica Simpson at +260%.
No graphics match that search. Try another brand, sector or data signal.
How to read the data
Editorial analysis with the source in view.
Every graphic is designed to make a complex market signal easier to understand without removing the context decision-makers need.
Defined scope
Each chart states the brands, market, geography and period included so comparisons remain clear.
Named sources
Source notes identify the public information, platform data or RetailBoss analysis behind the visual.
Editorial context
Rankings and signals are presented as market snapshots—not forecasts, valuations or financial advice.
Built for better decisions
Use Brand Data to find the signal behind the headline.
Benchmark brands
Compare market scale, digital visibility and demand across competitors and retail categories.
Track discovery
See how search, web traffic and AI platforms are changing the routes consumers use to find brands.
Brief teams
Bring concise, source-led visuals into strategy discussions, market reviews and editorial research.
Spot momentum
Identify where attention, product interest and competitive visibility are moving across retail.
Questions
About RetailBoss Insights
What is RetailBoss Insights?
RetailBoss Brand Data is a visual intelligence library of original infographics, rankings and analysis focused on the business of retail. It brings together signals on brand scale, digital visibility, consumer discovery and product demand.
What types of brand data are included?
The collection includes market capitalization comparisons, brand rankings, web traffic, AI search visibility, chatbot referral traffic and estimated consumer search demand across luxury, fashion, beauty, resale and retail.
How is the data sourced?
Each RetailBoss infographic states its source, time period and analytical scope. Sources may include public company information, third-party digital intelligence platforms, search data and RetailBoss analysis.
Can RetailBoss infographics be republished?
You may link to and cite RetailBoss Insights with clear attribution. For full-image republication, editorial licensing, custom research or commercial use licensing, contact RetailBoss for permission.
How often is Brand Data updated?
The library grows as RetailBoss publishes new research and visual analysis. Every graphic identifies the period measured so readers can distinguish current findings from historical snapshots.
Research & partnerships
Need a sharper view of your market?
Talk with RetailBoss about data-led editorial partnerships, custom visual research and market intelligence for retail-facing teams.
Contact RetailBoss